The free F1 live-timing feed gives you exactly five car telemetry channels: RPM, speed, gear, throttle, brake. That's it. No lateral G, no steering angle, no DRS state, no tyre temperatures. Broadcast graphics show drivers pulling multiple G through fast corners, and my feed has no channel for it at all.
But it does have speed, and it has GPS positions. A car following a curved path at speed v experiences a lateral acceleration of v squared times the curvature of that path. Both inputs were sitting in data I already held. So for F1Peak's analytics tier I derived the channel instead of wishing for it.
First, a spine measured in metres
Nothing downstream works until positions mean something physical. The feed's GPS coordinates arrive in the circuit's own arbitrary units, at roughly 3.7 Hz, with something like half a metre to two metres of noise. Before any analytics, I built a projection primitive (resample.ts, a pure module in the viewer engine): project every raw GPS sample onto the circuit centerline, producing an arc-length position s in metres plus a lateral offset d. The centerline never moves a car on screen; cars render at their true X/Y. It exists purely so the maths has a common axis.
Metres come from a calibration step: divide the circuit's known length by the outline's arc length in feed units. For Catalunya that worked out to 0.10124 metres per unit, the real 4657 m against 45999 outline units. The projection itself uses a coherent nearest-segment search with a hint carried between samples, cached per session bundle, so it stays cheap enough to run over full sessions.
Then I checked whether the spine could be trusted before stacking anything on it. Crossing the start/finish line in s-space gives lap windows, which gives lap times computed from pure geometry. Compared against the feed's own BestLapTime, the geometric lap times landed within roughly 0.6 to 1.1 seconds for 13 of 14 drivers, and the offset was consistent rather than random: the outline's seam sits slightly away from the actual timing line. A constant, explainable bias is fine. Noise would not have been.
Lateral G without an accelerometer
With s in hand, the analytics module (analytics.ts) computes, per fastest lap: lateral G, full-throttle percentage, heavy-braking percentage, and top and average speed. The lateral G is the textbook relation:
// centripetal: speed (m/s) squared times line curvature (1/m)
const aLat = v * v * curvature; // divide by 9.81 to read in G
Speed is a real telemetry channel, so that side is solid. Curvature is where the honesty work lives. It's a second-order property of position, and position is 3.7 Hz samples with metre-scale noise, so you cannot just difference raw points and call the wobble a force. The project rule, set back when Track 2 was planned, is to smooth the path between samples and never invent resolution. The curvature comes from the line, and the resulting number ships with a badge calling it a racing-line estimate. The plan is equally blunt about presentation: lateral metrics get shown as zones and trends, not centimetre-precision claims.
The same s-axis pays for itself twice more in that tab: real on-track order, and gap-to-car-ahead expressed in metres rather than seconds.
The number that proves the plumbing
Derived metrics have a credibility problem. Every stage of this pipeline (projecting samples, slicing lap windows, resampling laps onto a shared metre grid) is an opportunity to quietly clip a peak or shift a corner, and the output would still look plausible on a chart.
So I leaned on the one place my derived numbers overlap something the feed publishes directly: top speed. For the fastest laps in the compare view, my derived top speeds came out at 342 and 341 km/h, and both exactly matched the feed's own top-speed stat. That is a narrow check, but it's a real one. If resampling onto the distance grid were smearing the speed trace, the peak is precisely where it would show first.
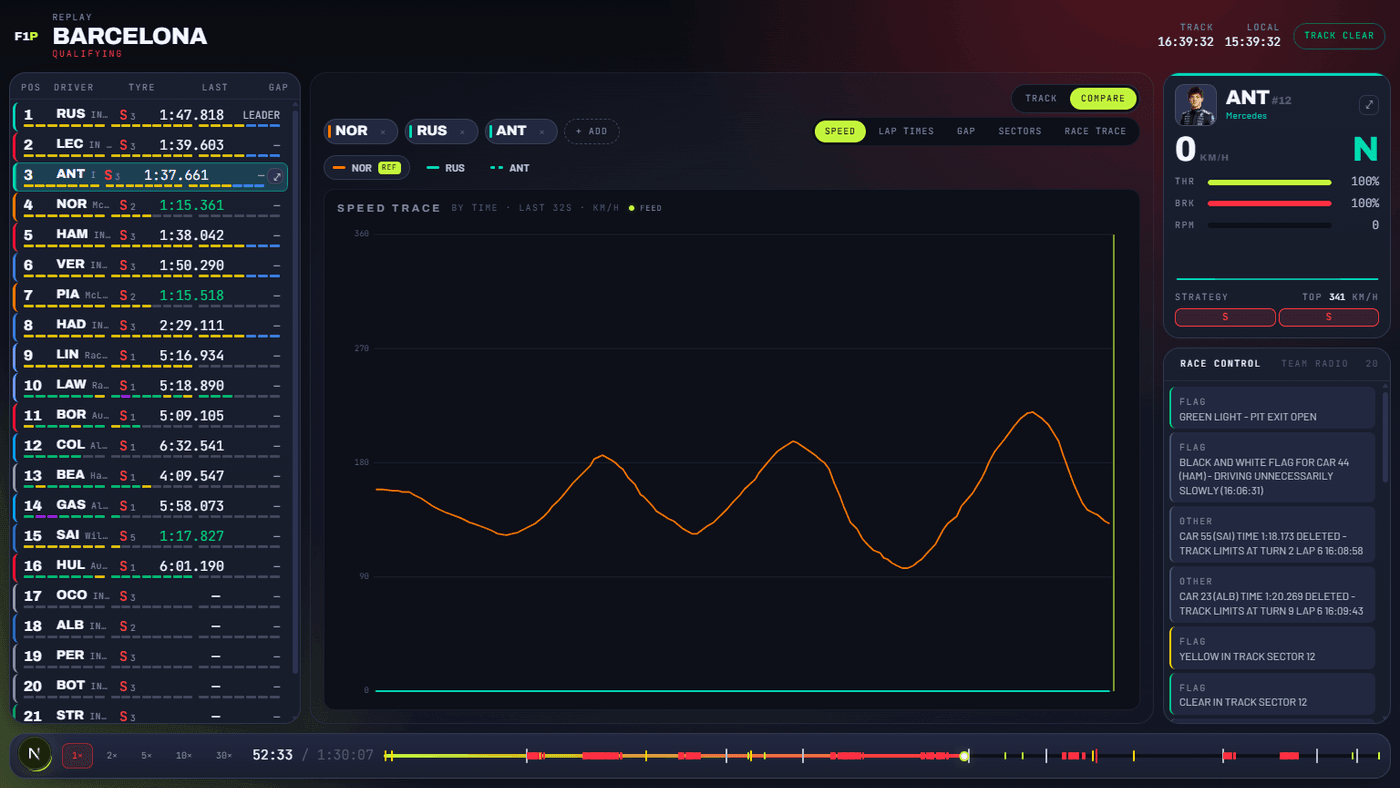
The surrounding feature is the distance-domain compare: each driver's fastest lap resampled onto a shared metre grid, so corners align regardless of pace, with a delta-time strip underneath showing who gains where. All of it was verified the way this project verifies everything: not by reading code, but by driving the built app in a browser at 1536x864 over a Barcelona qualifying replay and looking at a Hamilton versus Verstappen overlay. The build itself gated on a clean next build plus a clean typecheck. (The build phase itself was agent work; I mapped the existing engine with a recon fan-out before writing anything.)
The channels I refused to fake
The other half of the analytics tier is what's deliberately missing. The feed has no steering channel. No DRS state. No brake bias, no tyre temperatures. The brake channel it does have is effectively binary: it tells you the pedal is pressed, not how hard. Every one of those would be easy to fake convincingly, steering especially, since you could back-solve a plausible trace from the line geometry the same way I got curvature.
None of them ship. The project log entry for this phase records the rule in five words: omitted, never guessed. Anything that is derived rather than measured carries a visible tier chip saying so, and things with no reliable derivation, like DRS zones, sit on an explicit deferred list in my build records rather than appearing as decorated guesses.
That split is the actual design of the analytics tier. Deriving lateral G is legitimate because the physics is real, the inputs are real, and the result is labelled with exactly how it was obtained. Inventing a steering trace would use the same maths and be a lie about what the data contains. The 342/341 cross-check is what earns the first category its place on screen; the badge and the omissions are what keep it honest.