F1's free live-timing feed hands you two very different kinds of truth about a car. The first is position: X/Y samples in some unnamed coordinate unit, arriving at roughly 3.7 Hz, each one wandering half a metre to two metres off the true point. The second is time: lap and sector clocks measured by real timing loops in the tarmac, precise and completely opaque. For F1Peak's second build track I wanted analytics I derive myself (speed by distance, gaps in metres, lap comparisons that align corner-to-corner), and all of them need the same missing coordinate: how far around the lap is this car, in metres. The feed never says. The geometry has to.
A centreline the cars drew themselves
There is no official track geometry in the free feed either, so earlier in the project the server learned to derive one. Take every clean closed lap by every driver in a session, throw out any lap window containing a teleport or a dropped-sample discontinuity, resample each survivor to 720 points by normalised arc length, phase-align them to a reference lap, and take the per-point median, so an outlier chord in one driver's lap is outvoted by everyone else's. The seam, and the start/finish notch that marks it, gets parked on the longest straight so it never cuts across a corner. The best-quality outline per circuit is cached and reused for every session at that track, which means qualifying and the race see the identical shape.
One rule was settled during planning and never re-litigated: this centreline is for analytics only. Cars render at their true per-car X/Y. Two cars side by side stay side by side, a car in the gravel stays in the gravel, and nothing is ever snapped to the line for display. The centreline exists so the maths has a spine, not so the picture looks tidier than reality.
From (x, y) to (s, d)
Phase 2 of the build plan called this "the projection primitive" and was blunt that everything downstream depends on it. The implementation is resample.ts, a pure module in the viewer engine. For each raw GPS sample it finds the nearest segment of the 720-point centreline polyline, projects the point onto it, and emits two numbers: arc length s along the lap, and signed lateral offset d away from the line.
For s to mean anything it has to be in metres, and the feed's units are not metres. The fix is a small calibration table of known circuit lengths divided by each derived outline's arc length in feed units. For Catalunya:
4657 m (known lap length) / 45999 outline units = 0.10124 m per unit
One constant per circuit, and every downstream number (speed by distance, gap in metres, lap length) inherits real units.
Then there is the cost of the projection itself. The plan budgeted a shared segment index, O(log n) per sample. The built version is cheaper, because the input has structure the big-O analysis ignores: a car does not teleport between samples. The nearest segment for this sample is almost always the same segment as the last one, or its neighbour. So the search keeps a hint, starts from where the previous sample landed, and becomes O(1) per sample in practice. Projections are cached per data bundle, so scrubbing a replay never recomputes them.
Lap windows, and checking the answer
Once every sample carries an s, lap boundaries stop being something only the feed knows. A start/finish crossing is just s wrapping through the seam, and consecutive crossings bracket a real lap window per car. fastestLapWindow and speedByDistance fall straight out of that.
Which set up the test I actually cared about. Compute each driver's best lap purely from geometry, as the time between two seam crossings, and compare it against the feed's BestLapTime, which comes from hardware in the ground. In the Barcelona qualifying session I tested against, the geometric lap times landed within roughly 0.6 to 1.1 seconds of the feed for 13 of the 14 drivers.
A second off sounds mediocre until you look at the shape of the error. It is a consistent offset, not scatter. Noise in the sampling or the projection would push some drivers high and some low. A bias shared across nearly the whole field says the two measurements disagree about where the lap starts: my seam is parked on the longest straight by construction, and the official timing line is wherever the FIA actually put it. That is how I recorded it in the project log, a seam-versus-timing-line offset rather than noise. Honestly, the consistency was more reassuring than an exact match would have been. Thirteen independently derived lap times with the same explainable bias is a result; thirteen perfect matches would have made me go looking for the place where I was accidentally testing the feed against itself.
What the spine paid for
The same build session, which started with a recon pass of five agents mapping the engine, track and selector code before anything was written, shipped the first consumers. The by-distance compare resamples each driver's fastest lap onto a shared metre grid, so corners align regardless of pace, with a delta-time strip showing who gains where; I verified it on a Hamilton versus Verstappen overlay. The analytics tab derives lateral G as v² times curvature (badged as a racing-line estimate, because it comes from the line, not an accelerometer), full-throttle and heavy-braking percentages, and on-track order plus gap-to-car-ahead in metres read directly off s. That tab got its own cross-check too: the derived top speeds of 342 and 341 km/h matched the feed's own top-speed figures exactly.
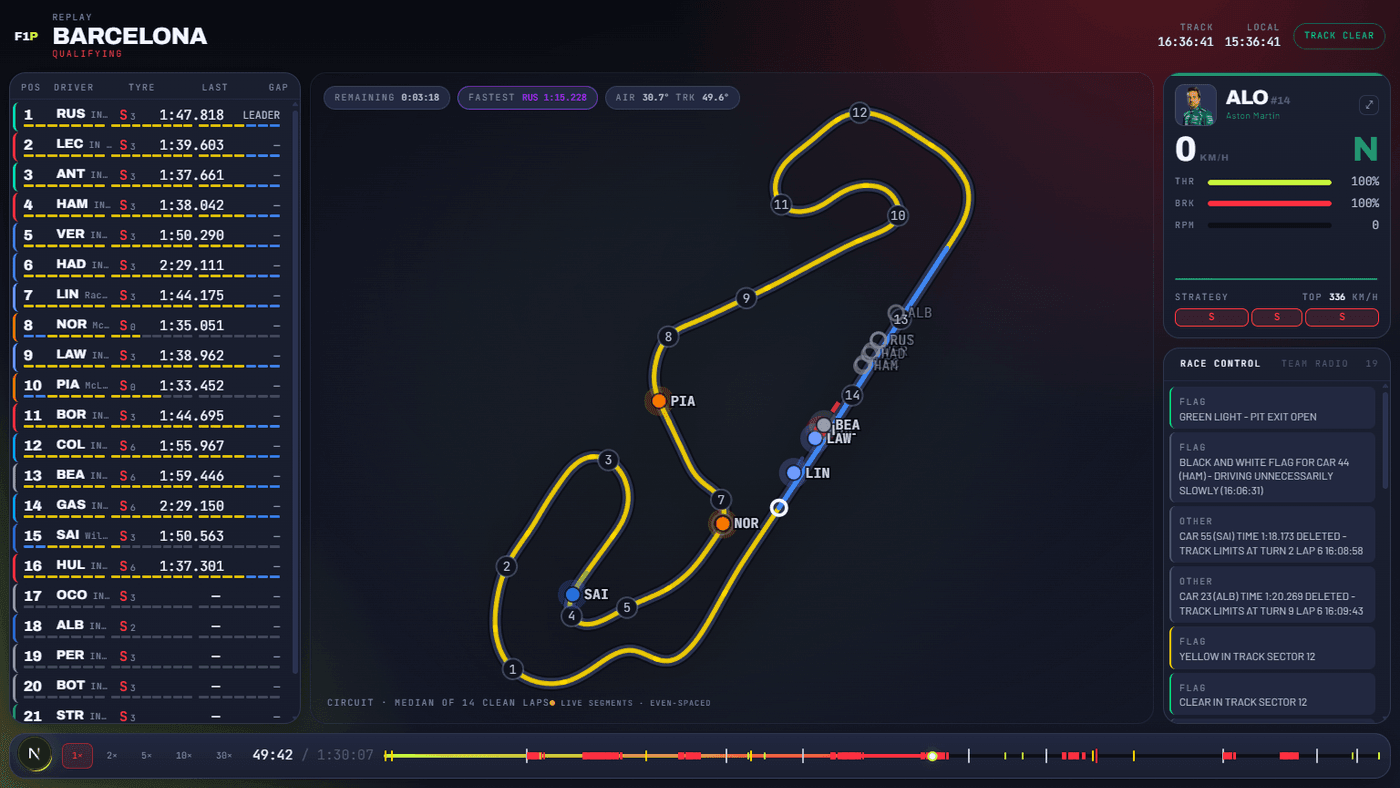
Some honesty survived the excitement. The mini-sector display lights up with real per-segment status from the feed, but the positions of those segments along the lap are still even-spaced and captioned as such in the UI; making them real from timed sector boundaries is on the list, where the data supports it. The lateral d gets the same treatment: with up to two metres of noise, on-track ordering is reliable but exact wheel-to-wheel gaps shimmer, so d is used for order and zones rather than centimetre claims.
The plan called Phase 2 the spine, and that turned out to be literal. One pure module, two numbers per sample, and suddenly lap windows, distance-domain comparison, gaps in metres and, eventually, authored 3D circuits all have a coordinate system to live in. The lesson I wrote back to my build records is about verification rather than geometry: a derived quantity becomes trustworthy the moment you check it against a ground truth the source already holds, and the best possible outcome of that check is not zero error. It is an error with a shape you can explain.