WC26 is my World Cup tracker, and it runs under a hard rule: everything on screen is real or it does not ship. The original plan had a section called "honest gaps" that wrote shot maps off entirely. No live player tracking, no shot coordinates, so the match centre gets a formation board and text. I treated that as a fact about the data for weeks. It turned out to be a fact about my normalizer.
The gap that wasn't
The app's data source is ESPN's public soccer feed. One summary fetch per match brings the header, the stats, the line-ups and a commentary[] array. The normalizer walked that array and kept exactly two fields per item: .text and .minute. Everything else on those objects was fetched and then discarded. So the plan's picture of "what the feed has" was really a picture of what survived normalization, and nobody, me included, had gone back and read the raw payload end to end.
That changed when I started a full redesign of the match centre. I ran a live audit of every route, three research passes, and then the step I should have taken at the start: pulling raw JSON for two real, live 2026 matches (Mexico-South Africa and Germany-Paraguay) and reading it directly.
What the payload actually carries
First, a flag. header.competitions[0].shotMapAvailable comes back true on this tournament's matches. One research pass had tested that flag on an older, unrelated ESPN event, got false, and could have closed the case there. Against this competition's own slug it returns true, confirmed on both matches.
Second, the coordinates. Commentary items describing shots carry a play object with real pitch positions:
commentary[].play
  type.type          "goal" | "shot-on-target" | "shot-off-target" |
                     "shot-blocked" | "corner-awarded" | penalty types
  fieldPositionX/Y   event origin, 0-100 normalized
  fieldPosition2X/Y  assist origin
  goalPositionY      where the shot crossed the goal line
Corner events carry the same coordinate fields plus the clock and sequence number every commentary item has. VAR decisions arrive as their own typed events with real decision text ("VAR Decision: No Goal Germany 1-1 Paraguay."). In-game penalties are typed separately from shootout kicks: penalty---scored, penalty---missed, penalty---saved.
Third, the shootout. Matches that go to penalties carry a top-level shootout[] array; matches that do not simply lack the key, which makes a clean gate:
shootout: [{ team, shots: [{ player, playerId, shotNumber, didScore }] }]
All of this rides inside the same summary response the app had been fetching since day one. Unlocking it cost zero new API calls. The bandwidth was already spent; the data was already on the wire.
Twelve kicks, in order
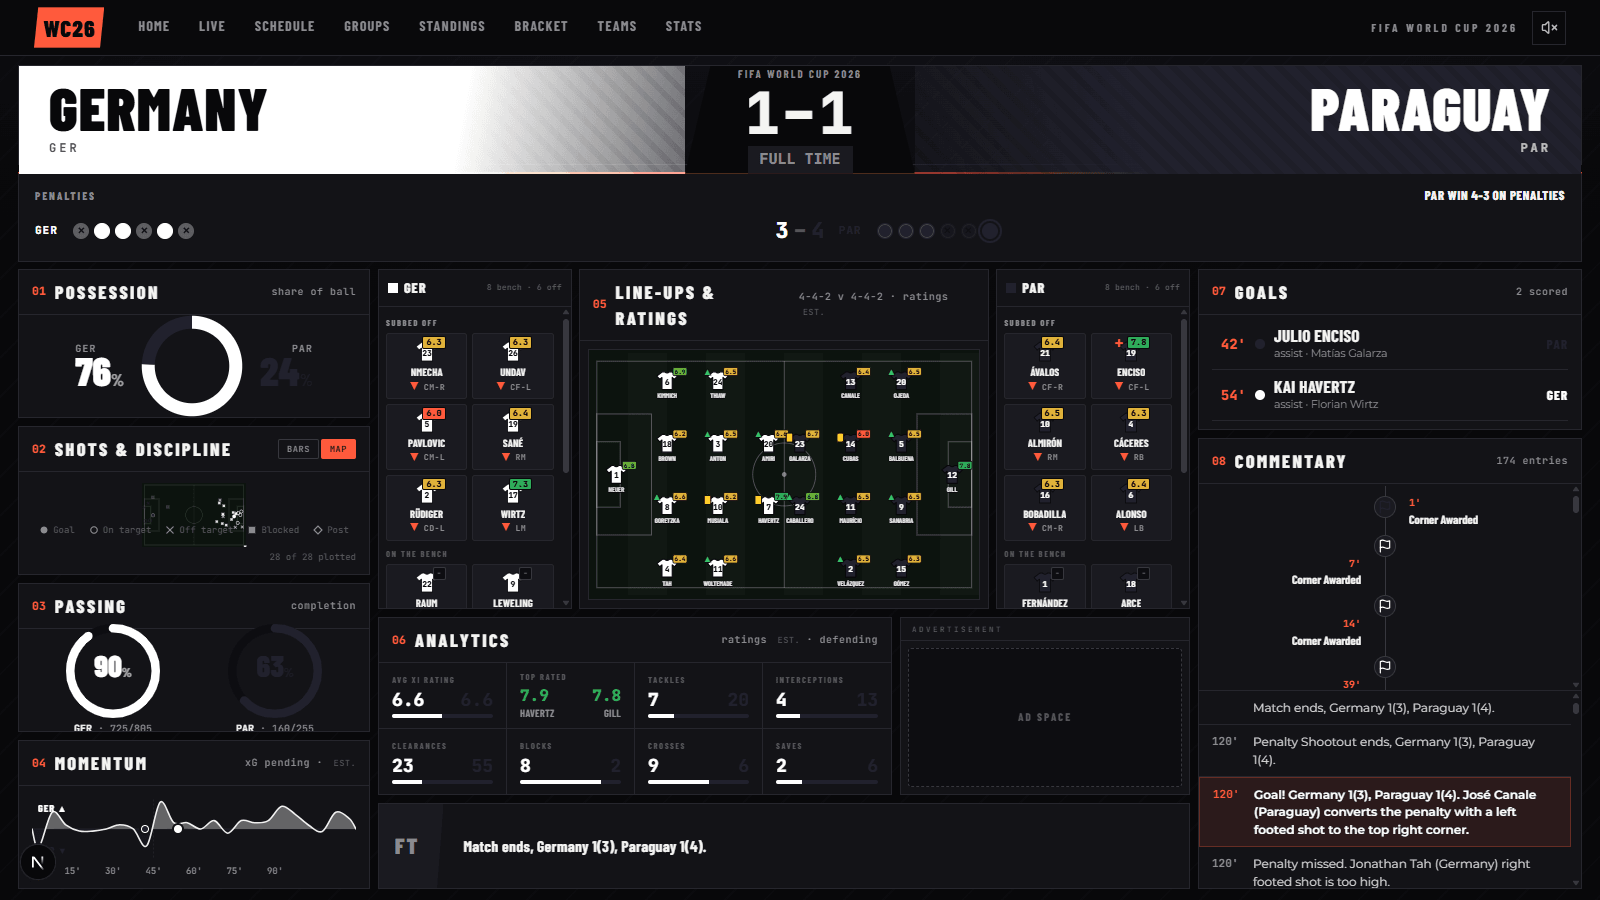
A finding like this needs checking against something that actually happened, so I verified the shootout array against the real one: Germany 1-1 Paraguay, Paraguay winning 4-3 on penalties. The feed carried six German kicks and six Paraguayan kicks in strict order, scorer by scorer, and replaying the cumulative score lands exactly on 4-3. By then two real shootouts had already happened in the tournament (Netherlands-Morocco was the other), so this was production data, not a hypothetical shape.
One field kept the UI honest. The per-kick record is a single boolean, didScore. It does not distinguish a save from a ball over the bar, so every unscored kick is labelled "missed" and nothing more is claimed.
The parsing landed as Phase 1 of the redesign, pure model work: the core package now produces Match.shots (a typed array with real coordinates and outcomes) and Match.shootout, with corners and VAR folded into the general event list.
The orientation discovery
The coordinates are 0-100 normalized, and the natural assumption is that they are normalized to the pitch: home attacks toward one end, away toward the other. They are not. ESPN normalizes fieldPositionX/Y to the acting team's own attacking direction. Every shot in the raw feed is aimed at the same virtual goal, whichever team took it.
Plot the values as fed and both teams' attacks pile onto one end. The fix lives in the shot map's toBoard() mapping: away-side events get a 180-degree rotation before plotting, so each team's shots land in the half they were actually attacking.
Corners confirmed the convention a phase later. The same Germany-Paraguay match carried 22 real corner-awarded events with the same coordinate fields, and after the same rotation their positions spread across the full 0-100 range. Not all of them sit tight on the corner arc, and I plot them as fed rather than snapping them to where a corner "should" be, because the moment I start correcting data toward my expectations I am back to fabrication.
The panel that rendered 25 pixels tall
Phase 2a built the visible layer: a ShootoutStrip (kick-by-kick circles, hero treatment on the match page, a compact variant inside bracket cards for penalty ties), the ShotMap itself with markers shape-coded by outcome, and an event spine replacing the old flat text chip list. Part of the implementation ran through agents, and my own verification pass caught what the agent report had called done: the shot map's SVG was rendering at 324 by 25 pixels. Present in the DOM, invisible to a human. The match centre's one-screen-fit column was tuned for exactly four equal-height flex panels; a fifth always-visible panel broke that balance, and an aspect-ratio declaration on the SVG fought flex-shrink instead of filling the space that remained. The fix folded the map into the existing shots panel behind a Bars/Map toggle, restoring the four-panel balance, and sized the SVG with flex and a minimum height so preserveAspectRatio="meet" letterboxes instead of distorting. A later review pass moved the map again, onto the full-width pitch in the line-ups area behind a Line-ups/Shots toggle, which is where it lives now, with room to breathe.
What stayed off the board
Finding real data did not loosen the rule for anything else. Live win probability is genuinely absent from ESPN's soccer feed, so the momentum chart stays self-derived and labelled "est.". Heat maps and average-position data have no free source for internationals. Per-shot xG is not in the payload. A commercial API sells live shot data at about $40 a month, which I took as confirmation that the coordinates sitting in the free feed are a real product, worth plotting carefully.
The finding itself also got corrected, which felt right. A later verification pass against the live feed found that keyEvents[] carries coordinates too, with athlete IDs attached but fewer events, while commentary[].play remains the fuller shot set without IDs. It also found there is no goalPositionX (goal-mouth placement is one axis only), and that the feed's source identifier points at Stats Perform/Opta, meaning these are the real coordinates broadcast graphics run on, not estimates.
The uncomfortable part is how long it all sat there. The app had been downloading every one of those coordinates on every fetch of every match and keeping two text fields. The gap was never in the feed; it was in the normalizer, and my plan had documented the normalizer's limits as if they were the world's. My build records now carry the corrected data catalog, and the habit that came out of it: when a plan says "the data doesn't exist," the first question is whether anyone has read the raw payload end to end, or just the fields we happened to keep.